SEO continues to be a hot topic among small and large business regardless of industry and sales process. If your business is able to, and focused on, bringing more sales leads in all stages of the funnel through its website, you should be looking for ways to improve your organic SERP rank for queries relevant to your business. This is much easier said than done but we have created a report that is easy to understand and share with all members of your organization in order to demonstrate the results of your SEO efforts.
As an agency that focuses on digital, we are well aware of the importance and challenges faced by companies that want to see the ROI of their SEO investments whether the strategy is managed in-house, by an agency, or a combination of both. One question we hear over and over is “how do I know if SEO is even working for my business?” Our new SEO Overview Dashboard can help answer that question.
Included in the report are the following charts/tables/graphics that help tell your SEO story. Aside from the pie chart showing sessions by source/medium, every section of the report was custom filtered to only include the results from ORGANIC traffic.
Our SEO Overview Dashboard is now available in the Google Solutions Gallery. CLICK HERE TO VIEW IN GOOGLE SOLUTIONS GALLERY
When people come to the website, what page do they land on first and what percentage of those organic visitors are new? Start with the basics. How many organic sessions are coming in and are they the same visitors or is the site bringing in enough new prospects?

Which keywords or queries are people using in search engines to discover my website? – Knowing which organic keywords drive traffic to a website can influence PPC and content strategies.

After organic visitors land on my website, which pages do they move to, and of those pages, which are most popular? – Adding more content to a website helps to increase the number of individual pages that can be visited which can improve your average session duration and bounce rate metrics.

When organic visitors decide to leave my website, which pages are they on before they exit? – This can be very helpful for e-commerce websites that need to simplify the checkout process.

Over time, how many organic sessions are counted? – This graph can be adjusted to any date range you’d like to see and can be grouped by day, week or month to make it easier to highlight trends.

How many organic sessions are there by day of the week? – Understanding this may dictate when you decide to publish new content.

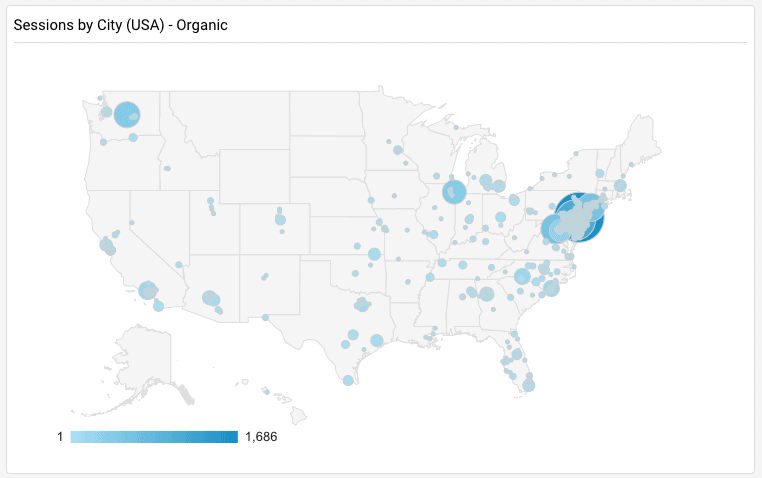
Where are my organic visitors located? – If you are planning any type of advertising, it is helpful to know where most organic visitors are located.

The only section of the report not filtered to only show organic traffic, the ‘Sessions by Source/Medium’ chart gives you a good sense of what percentage of total traffic is organic.

SEO is the process of continuously creating quality content and restructuring your website in order to improve your organic rank. As you can see, this report highlights crucial data points directly related to SEO and its impact.
Our SEO Overview Dashboard is now available in the Google Solutions Gallery. CLICK HERE TO VIEW IN GOOGLE SOLUTIONS GALLERY
If you find our SEO overview Dashboard useful, consider importing our other dashboards:
Cool Nerds Marketing AdWords Performance Dashboard – The Cool Nerds Marketing Google AdWords Performance Overview Dashboard provides a simple overview of key metrics and data resulting from Google AdWords efforts. This dashboard can be easily tailored to highlight data from any campaign strategy. CLICK HERE TO VIEW IN GOOGLE SOLUTIONS GALLERY
Cool Nerds Marketing Audience Insights Dashboard – This simple dashboard provides an excellent high-level overview of a website audience. Scheduling weekly, monthly and quarterly emails of this report is recommended. CLICK HERE TO VIEW IN GOOGLE SOLUTIONS GALLERY
Cool Nerds Marketing Traffic Overview Dashboard – The Cool Nerds Marketing Traffic Overview Dashboard provides a high-level overview of key website traffic metrics and acquisition data. CLICK HERE TO VIEW IN GOOGLE SOLUTIONS GALLERY


